      library(tidyverse)
      library(data.table)
      install.packages("ggcorrplot")
      library(ggcorrplot)
# Importing our files
powerliftingdata <- fread('openpowerlifting.csv')
meetsdata <- fread('meets.csv') > glimpse(powerliftingdata)
Observations: 386,414
Variables: 17
$ MeetID 0, 0, 0, 0, 0, 0, 0, 0, 0, 0, 0, 0, 0, 0, 0, 0, 0, 0, 0, 0, 0, 0, 0, 0, 0, 0, 0, 0, 0, 0, 0,...
$ Name "Angie Belk Terry", "Dawn Bogart", "Dawn Bogart", "Dawn Bogart", "Destiny Dula", "Courtney N...
$ Sex "F", "F", "F", "F", "F", "F", "F", "F", "F", "F", "F", "F", "F", "F", "F", "F", "F", "F", "F...
$ Equipment "Wraps", "Single-ply", "Single-ply", "Raw", "Raw", "Wraps", "Raw", "Raw", "Wraps", "Raw", "W...
$ Age 47, 42, 42, 42, 18, 28, 60, 60, 52, 52, 24, 56, 56, 54, 17, 32, 25, 18, 22, 56, 30, 44, 34, ...
$ Division "Mst 45-49", "Mst 40-44", "Open Senior", "Open Senior", "Teen 18-19", "Open Senior", "Mst 60...
$ BodyweightKg 59.60, 58.51, 58.51, 58.51, 63.68, 62.41, 67.31, 67.31, 65.95, 65.95, 65.50, 71.21, 71.21, 7...
$ WeightClassKg "60", "60", "60", "60", "67.5", "67.5", "67.5", "67.5", "67.5", "67.5", "67.5", "75", "75", ...
$ Squat4Kg NA, NA, NA, NA, NA, -183.7, NA, NA, NA, NA, NA, NA, NA, NA, NA, NA, NA, NA, NA, NA, -183.7, ...
$ BestSquatKg 47.63, 142.88, 142.88, NA, NA, 170.10, 124.74, 124.74, 120.20, NA, 138.35, 120.20, 120.20, 1...
$ Bench4Kg NA, NA, NA, NA, NA, NA, NA, NA, NA, NA, NA, NA, NA, NA, NA, NA, NA, NA, NA, NA, NA, NA, NA, ...
$ BestBenchKg 20.41, 95.25, 95.25, 95.25, 31.75, 77.11, 95.25, 95.25, 54.43, NA, 65.77, 43.09, 43.09, 74.8...
$ Deadlift4Kg NA, NA, NA, NA, NA, NA, NA, NA, NA, NA, NA, NA, NA, NA, NA, NA, NA, NA, NA, NA, 204.12, NA, ...
$ BestDeadliftKg 70.31, 163.29, 163.29, NA, 90.72, 145.15, 163.29, 163.29, 108.86, 108.86, 136.08, 129.27, 12...
$ TotalKg 138.35, 401.42, 401.42, 95.25, 122.47, 392.36, 383.28, 383.28, 283.49, 108.86, 340.20, 292.5...
$ Place "1", "1", "1", "1", "1", "1", "1", "1", "1", "1", "1", "1", "1", "1", "1", "1", "1", "1", "1...
$ Wilks 155.05, 456.38, 456.38, 108.29, 130.47, 424.40, 391.98, 391.98, 294.25, 112.99, 354.89, 287.... > glimpse(meetsdata)
Observations: 8,482
Variables: 8
$ MeetID 0, 1, 2, 3, 4, 5, 6, 7, 8, 9, 10, 11, 12, 13, 14, 15, 16, 17, 18, 19, 20, 21, 22, 23, 24, 25, 2...
$ MeetPath "365strong/1601", "365strong/1602", "365strong/1603", "365strong/1604", "365strong/1605", "365s...
$ Federation "365Strong", "365Strong", "365Strong", "365Strong", "365Strong", "365Strong", "365Strong", "365...
$ Date "2016-10-29", "2016-11-19", "2016-07-09", "2016-06-11", "2016-04-10", "2017-04-22", "2017-01-21...
$ MeetCountry "USA", "USA", "USA", "USA", "USA", "USA", "USA", "USA", "USA", "USA", "USA", "USA", "USA", "USA...
$ MeetState "NC", "MO", "NC", "SC", "SC", "NC", "GA", "MO", "SC", "NC", "IN", "IN", "NC", "SC", "CA", "NV",...
$ MeetTown "Charlotte", "Ozark", "Charlotte", "Rock Hill", "Rock Hill", "Charlotte", "Martinez", "Lake Oza...
$ MeetName "2016 Junior & Senior National Powerlifting Championships", "Thanksgiving Powerlifting Classic"... > powerliftingdata %>%
+ distinct(Name) %>%
+ count()
# A tibble: 1 x 1
n
1 136687
> powerliftingdata %>%
+ select(BodyweightKg) %>%
+ is.na() %>%
+ sum()
[1] 2402
> powerliftingdata %>%
+ select(Age) %>%
+ summarize(missingval = sum(is.na(Age)),
+ min = min(Age, na.rm = T),
+ max = max(Age, na.rm = T),
+ mean = mean(Age, na.rm = T))
missingval min max mean
1 239267 5 95 31.66824
> powerliftingdata %>%
+ select(Division) %>%
+ distinct() %>%
+ count()
# A tibble: 1 x 1
n
1 4247
> powerliftingdata %>%
+ filter( BodyweightKg <= 0 |
+ BestSquatKg <= 0 |
+ BestBenchKg <= 0 |
+ BestDeadliftKg <= 0) %>%
+ count()
# A tibble: 1 x 1
n
1 2919 #Removing unecessary columns, extreme ages and missing body weights
powerliftingdataclean <- powerliftingdata %>%
select(-Division, -Squat4Kg, -Bench4Kg, -Deadlift4Kg,
-TotalKg, -Wilks, -WeightClassKg, -Place) %>%
filter(Age >= 15 & Age <= 80) %>%
na.omit(cols='BodyweightKg')
# Also having gender as 'F' and 'M' makes analysis hard/worse, let's turn it into factors.
powerliftingdataclean$Sex <- powerliftingdataclean$Sex %>%
as.factor()
# Let's also turn Equipment to factors since we only have 4 uniques
powerliftingdataclean$Equipment <- powerliftingdataclean$Equipment %>%
as.factor()
# Also there seem to be about 1100 values that are negative (weights), let's remove those
powerliftingdataclean <- powerliftingdataclean %>%
filter( BodyweightKg >= 0 &
BestSquatKg >= 0 &
BestBenchKg >= 0 &
BestDeadliftKg >= 0)
# Let's order the Equipment so our graphs look nice, Raw -> Wraps -> Single-ply -> Multi-ply
powerliftingdataequipordered <- powerliftingdataclean
powerliftingdataequipordered$Equipment <- factor(powerliftingdataequipordered$Equipment,
levels = c('Raw','Wraps','Single-ply','Multi-ply'),
ordered = TRUE)
| Firstname | Lastname | |
|---|---|---|
| John | Doe | john@example.com |
| Mary | Moe | mary@example.com |
| July | Dooley | july@example.com |
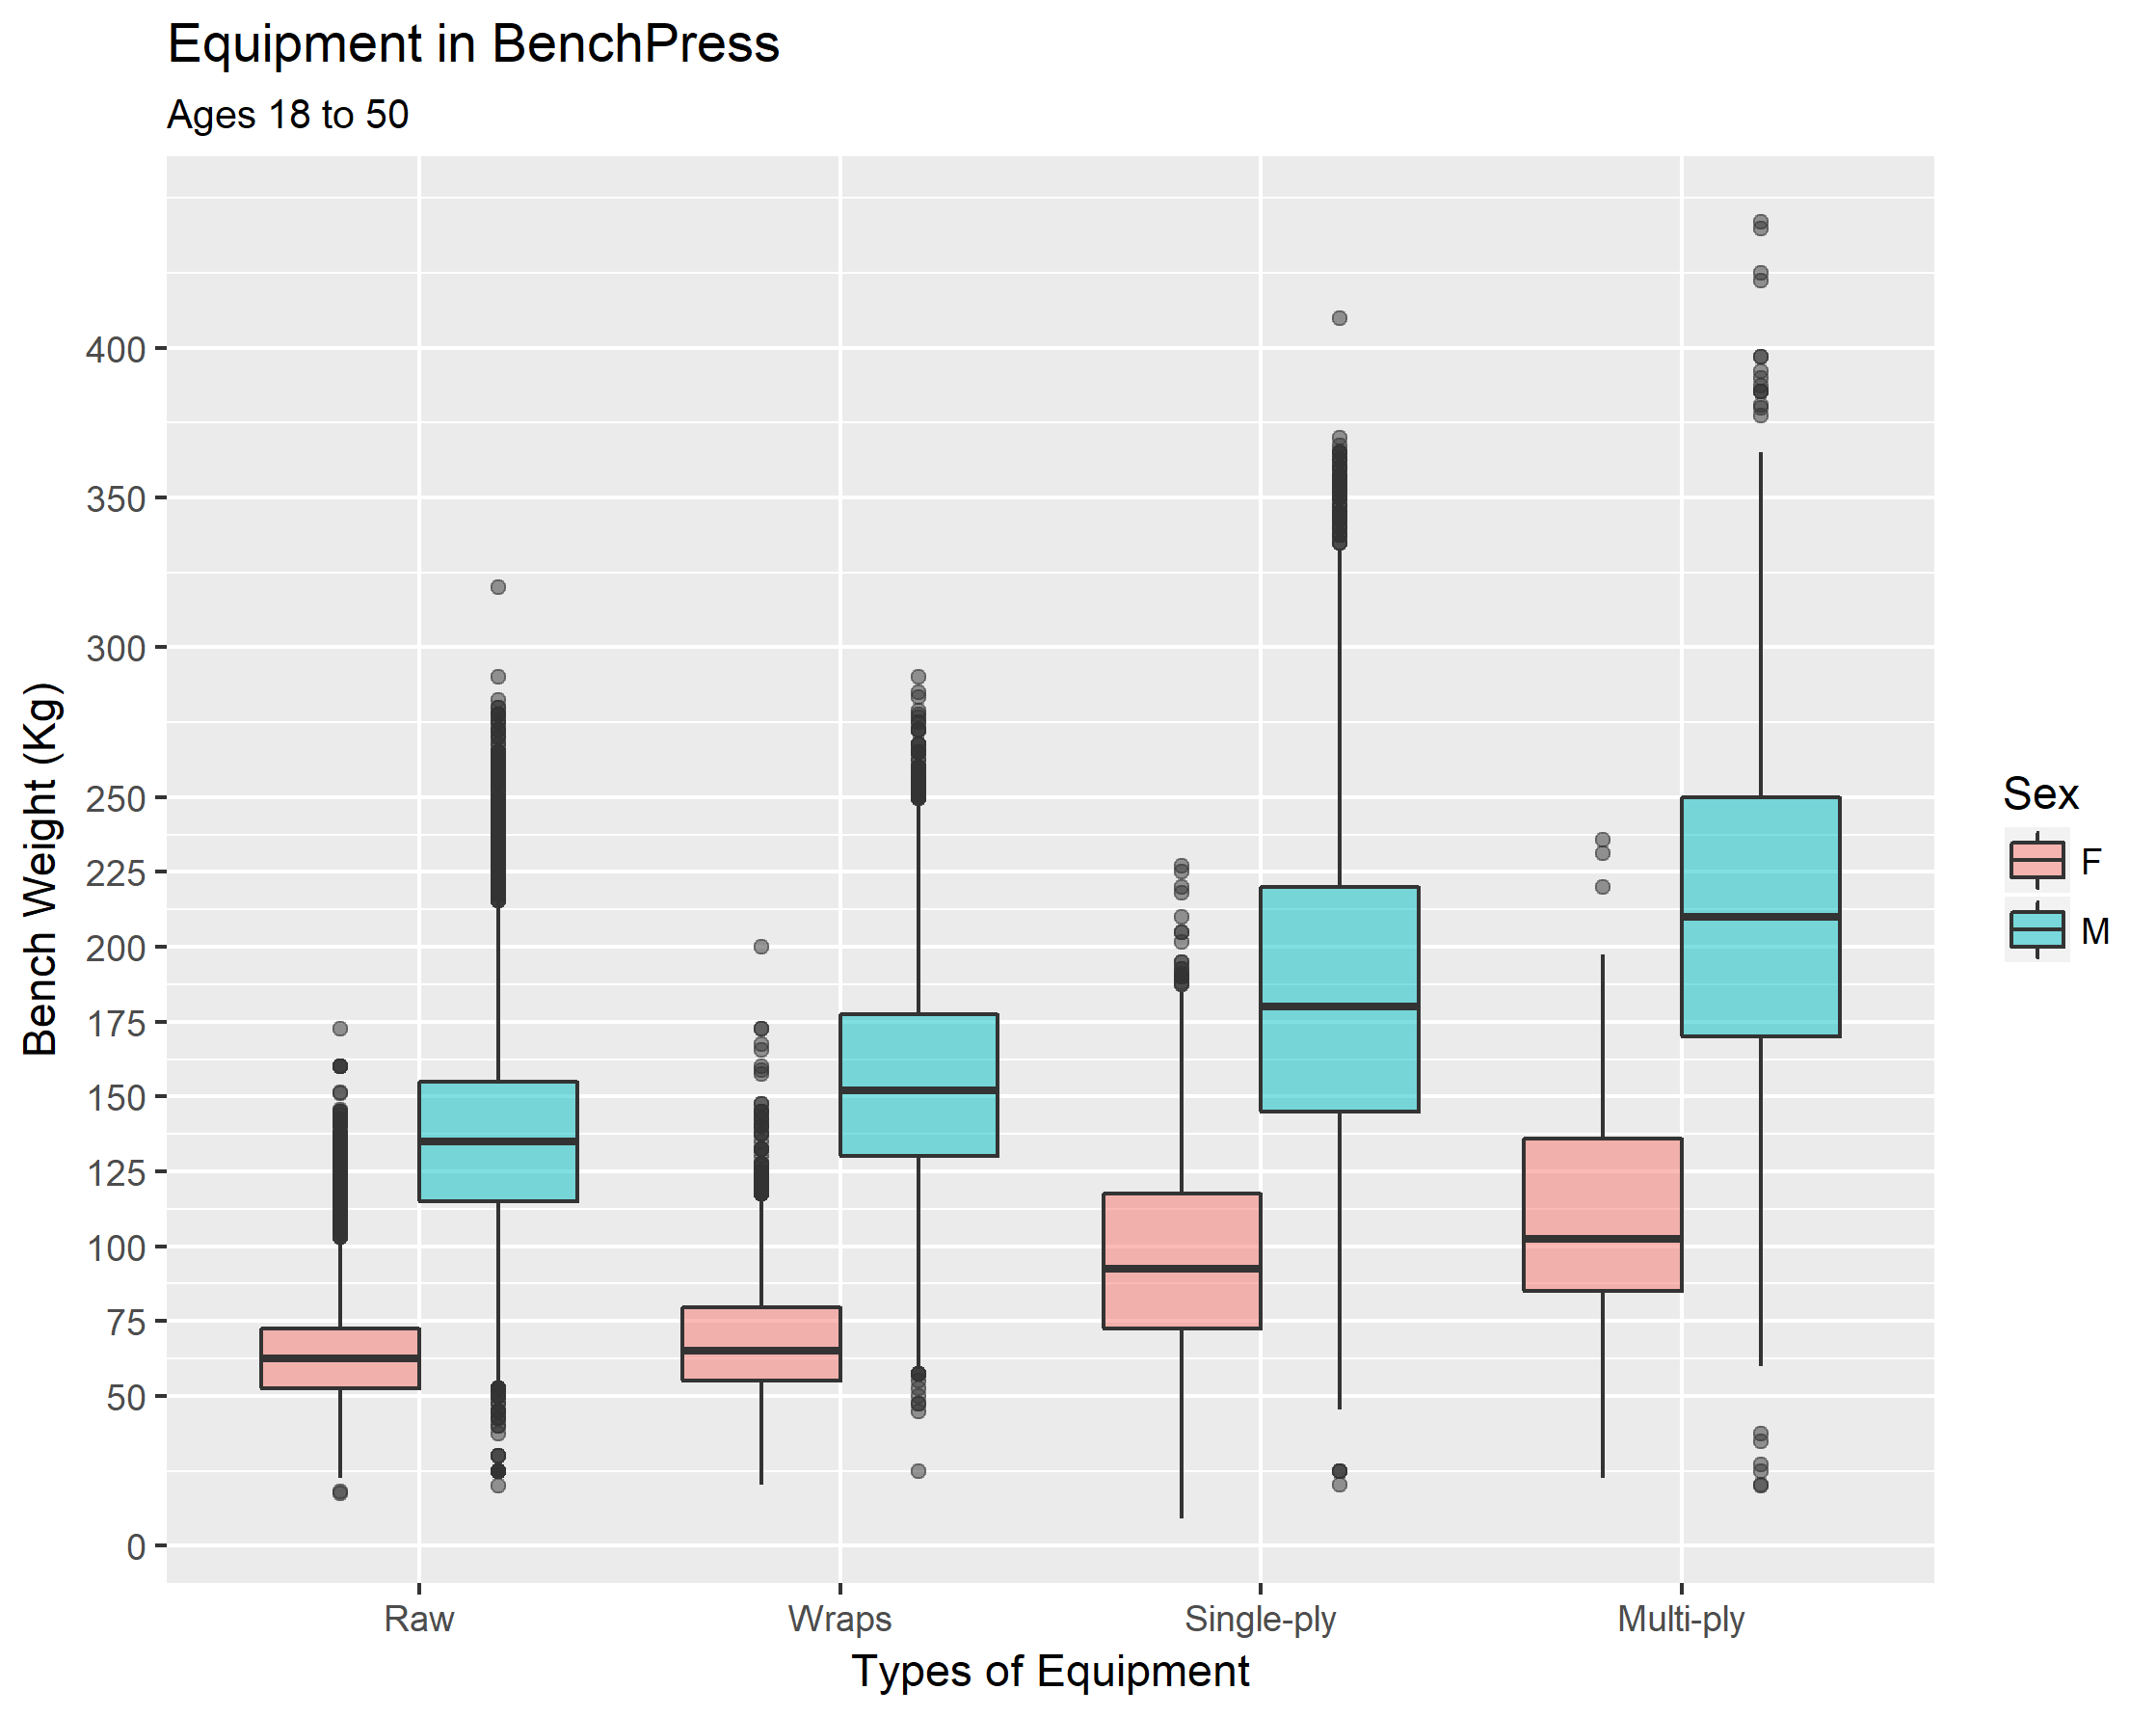
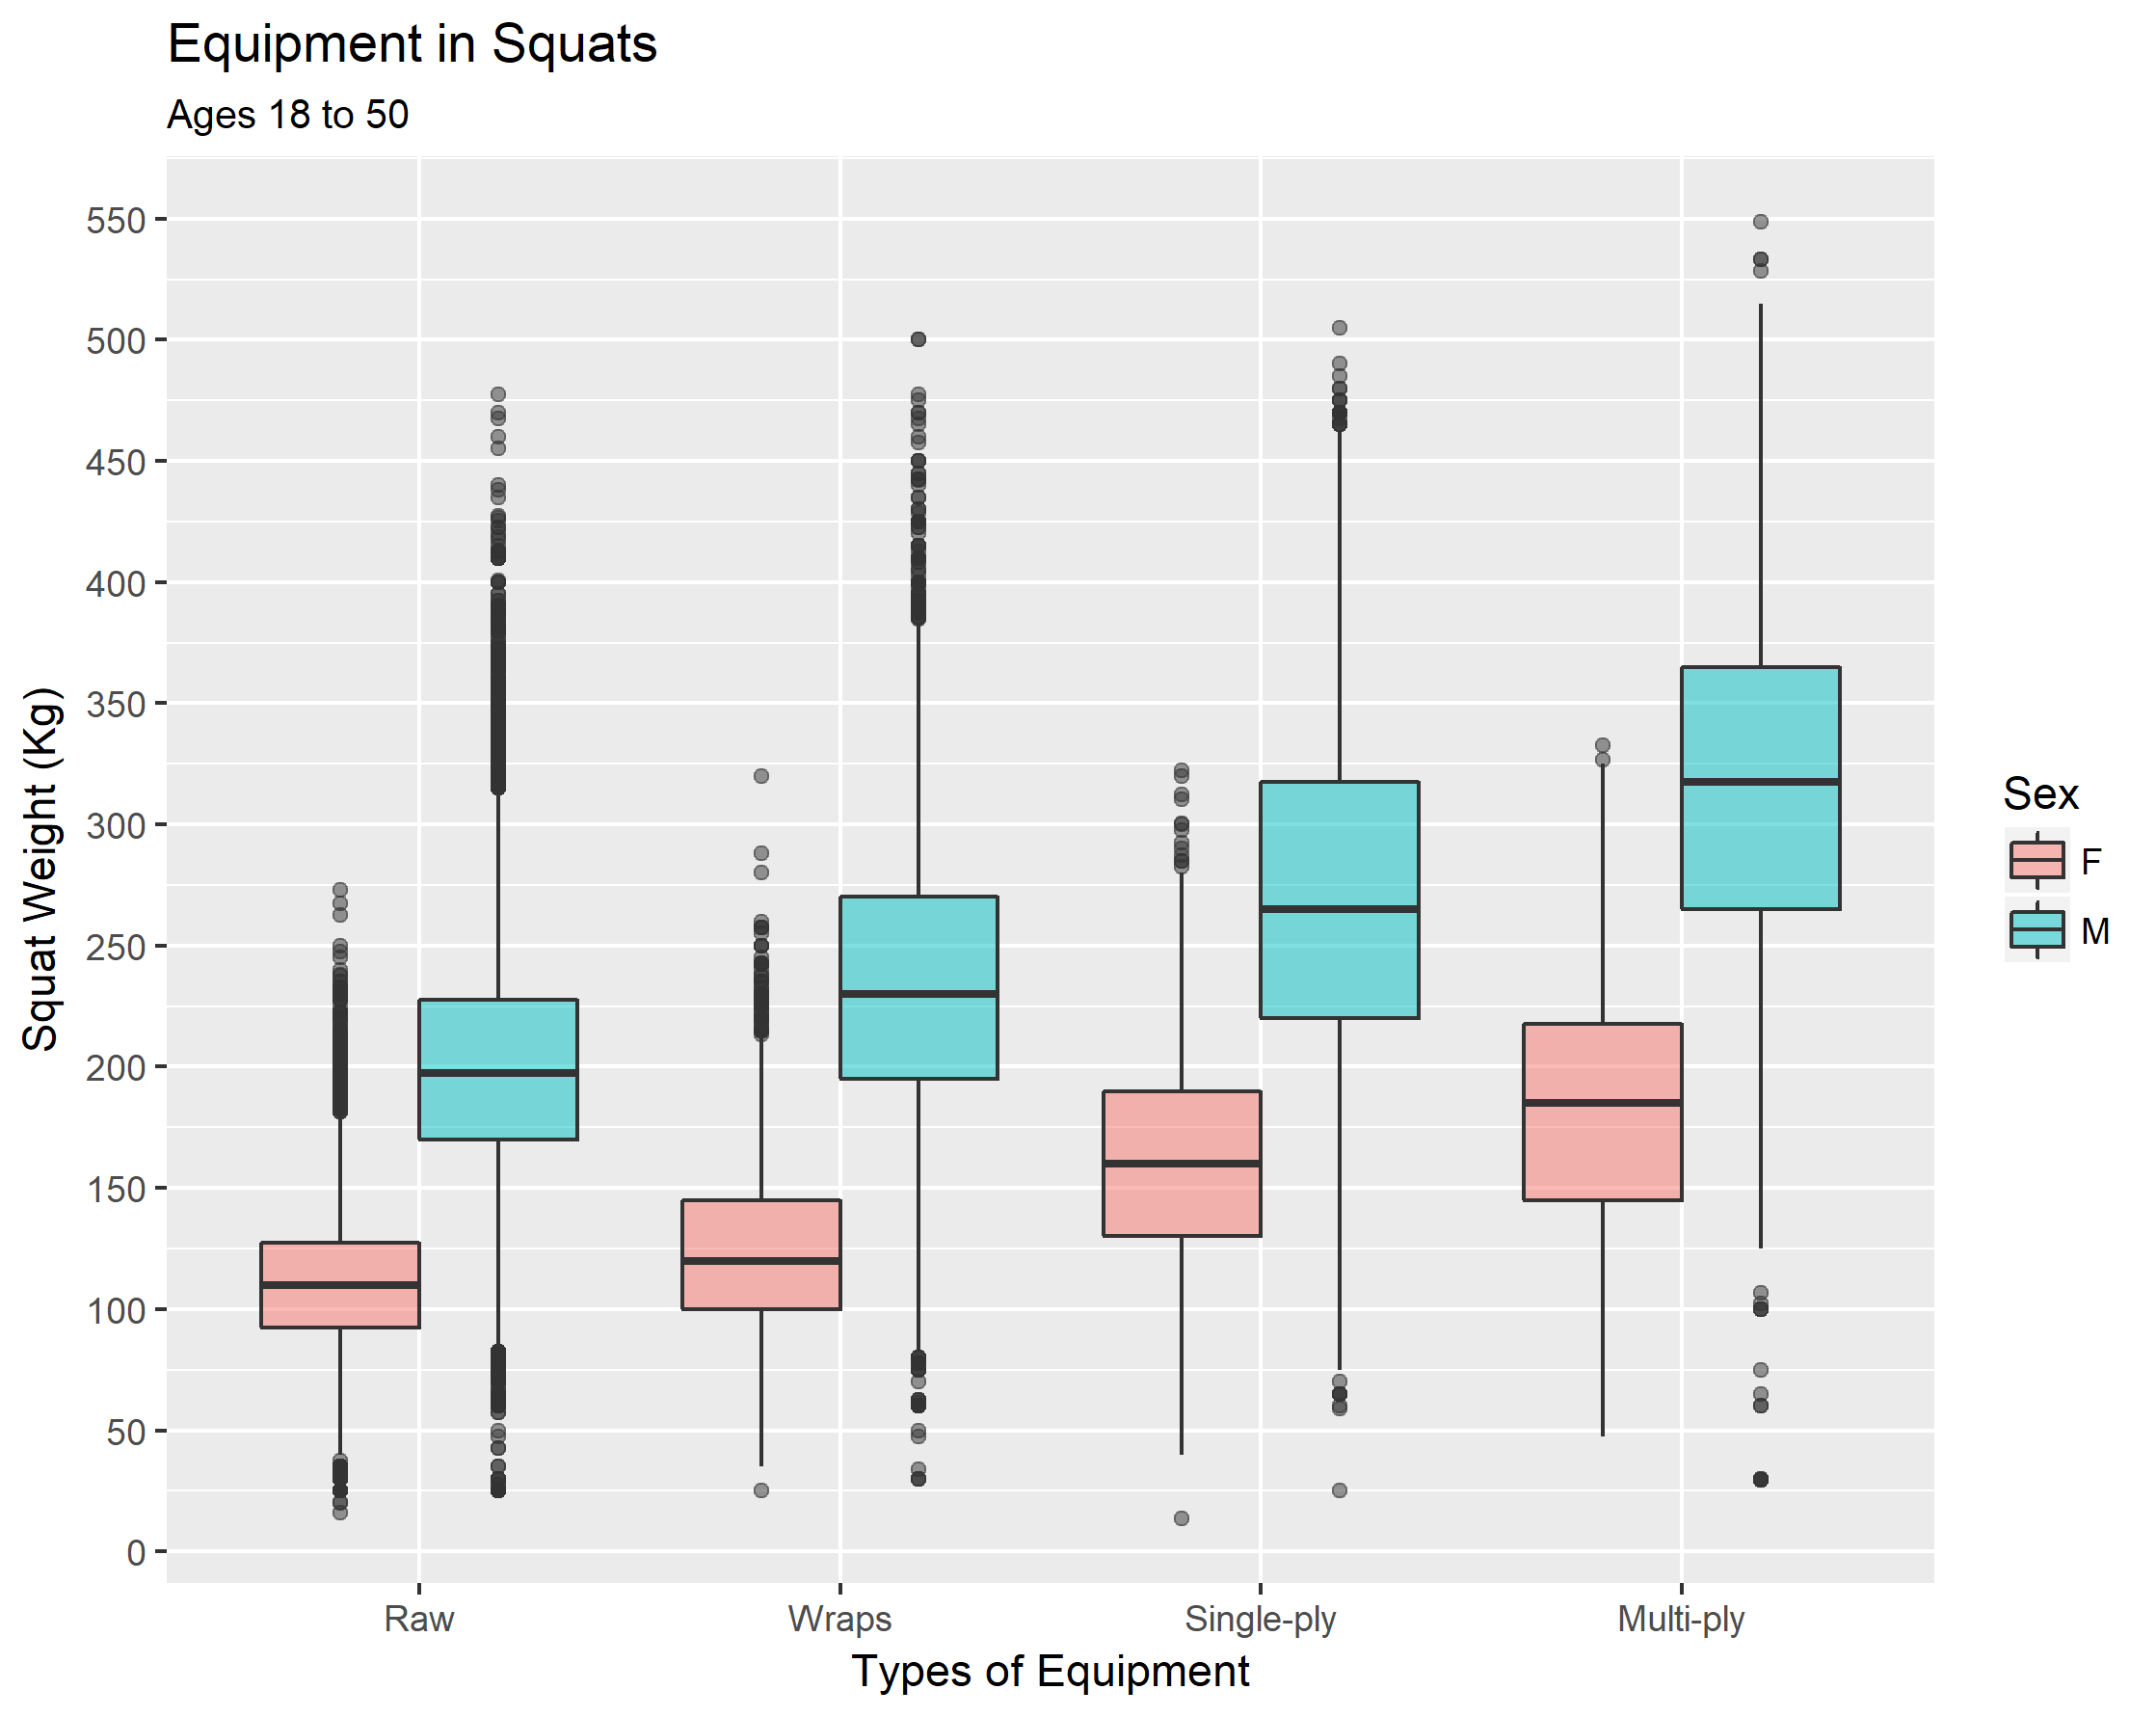
> test2 <- powerliftingdataclean %>%
+ group_by(Equipment) %>%
+ summarize(AvgAge = mean(Age),
+ Equipchoice = paste0(round(100*n()/105252,1), '%'),
+ AvgWeight = mean(BodyweightKg),
+ AvgTotal = mean(TotalKg),
+ AvgBench = mean(BestBenchKg),
+ AvgSquat = mean(BestSquatKg),
+ AvgDeadlift = mean(BestDeadliftKg))
> test2
# A tibble: 4 x 8
Equipment AvgAge Equipchoice AvgWeight AvgTotal AvgBench AvgSquat AvgDeadlift
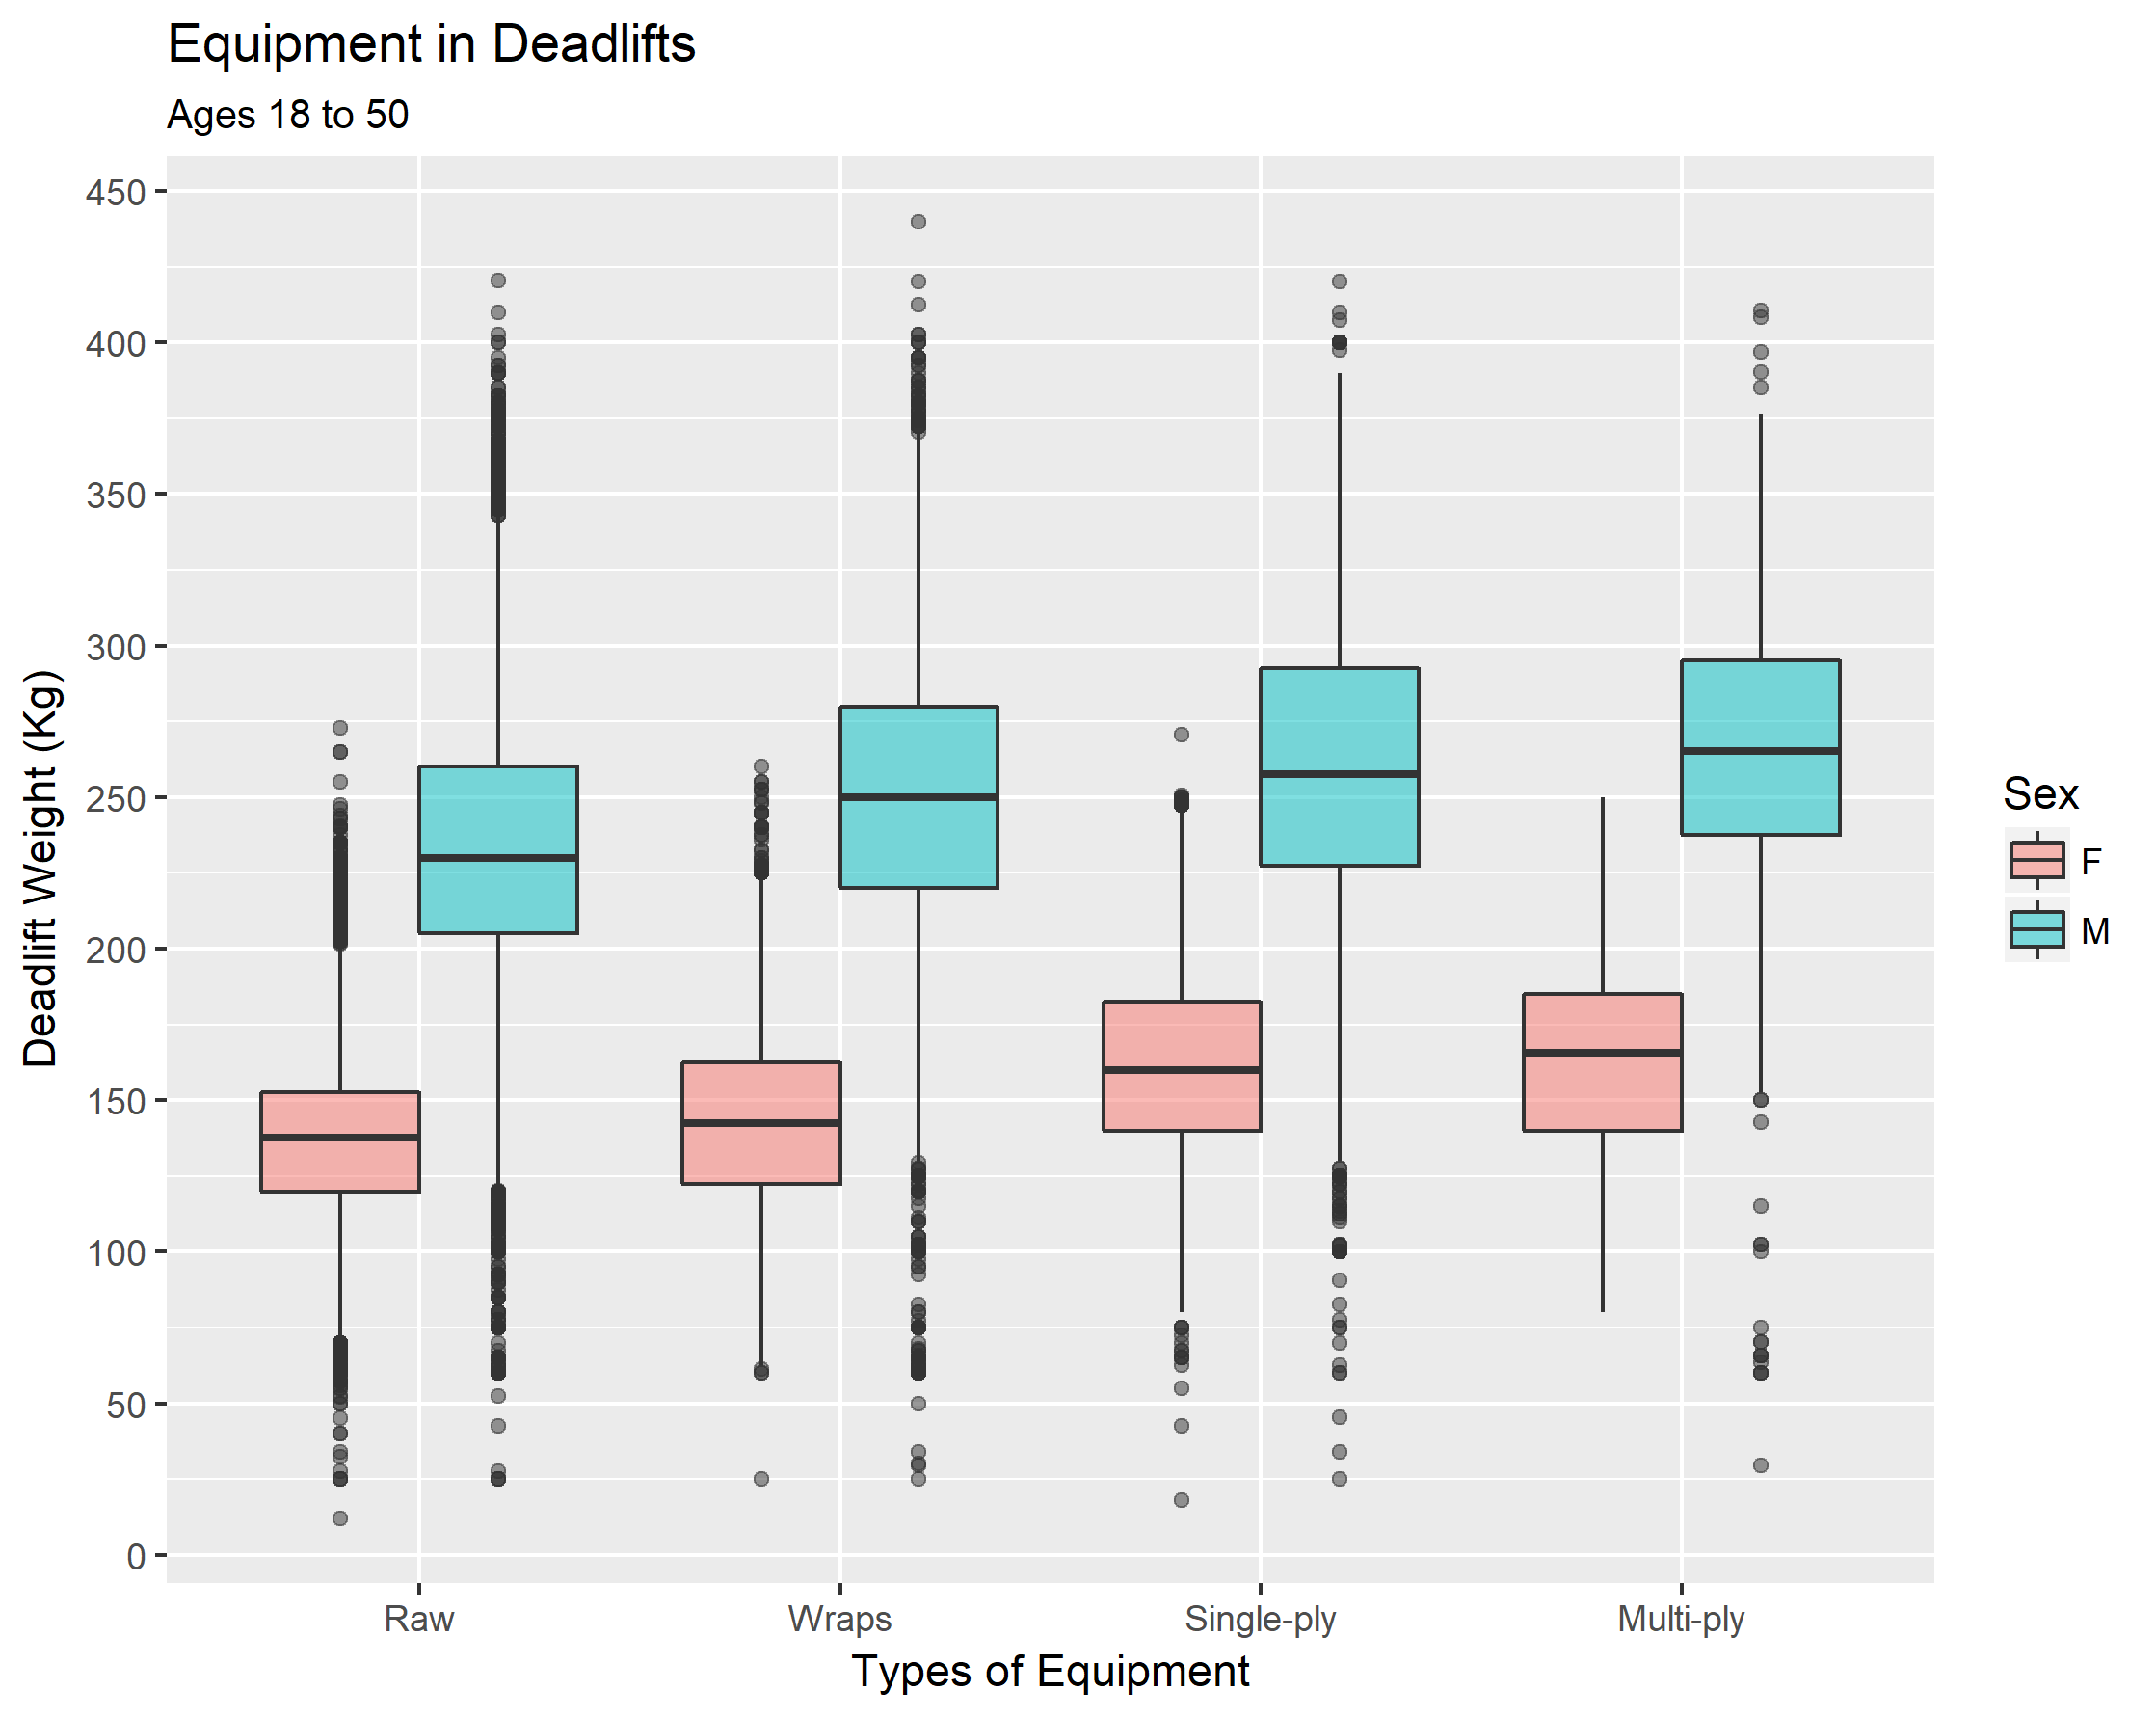
1 Multi-ply 36.5 1.7% 98.6 711 188 281 242
2 Raw 29.3 65.5% 83.4 468 108 165 195
3 Single-ply 31.9 12.2% 84.5 572 143 216 214
4 Wraps 30.9 20.6% 92.0 548 129 201 218
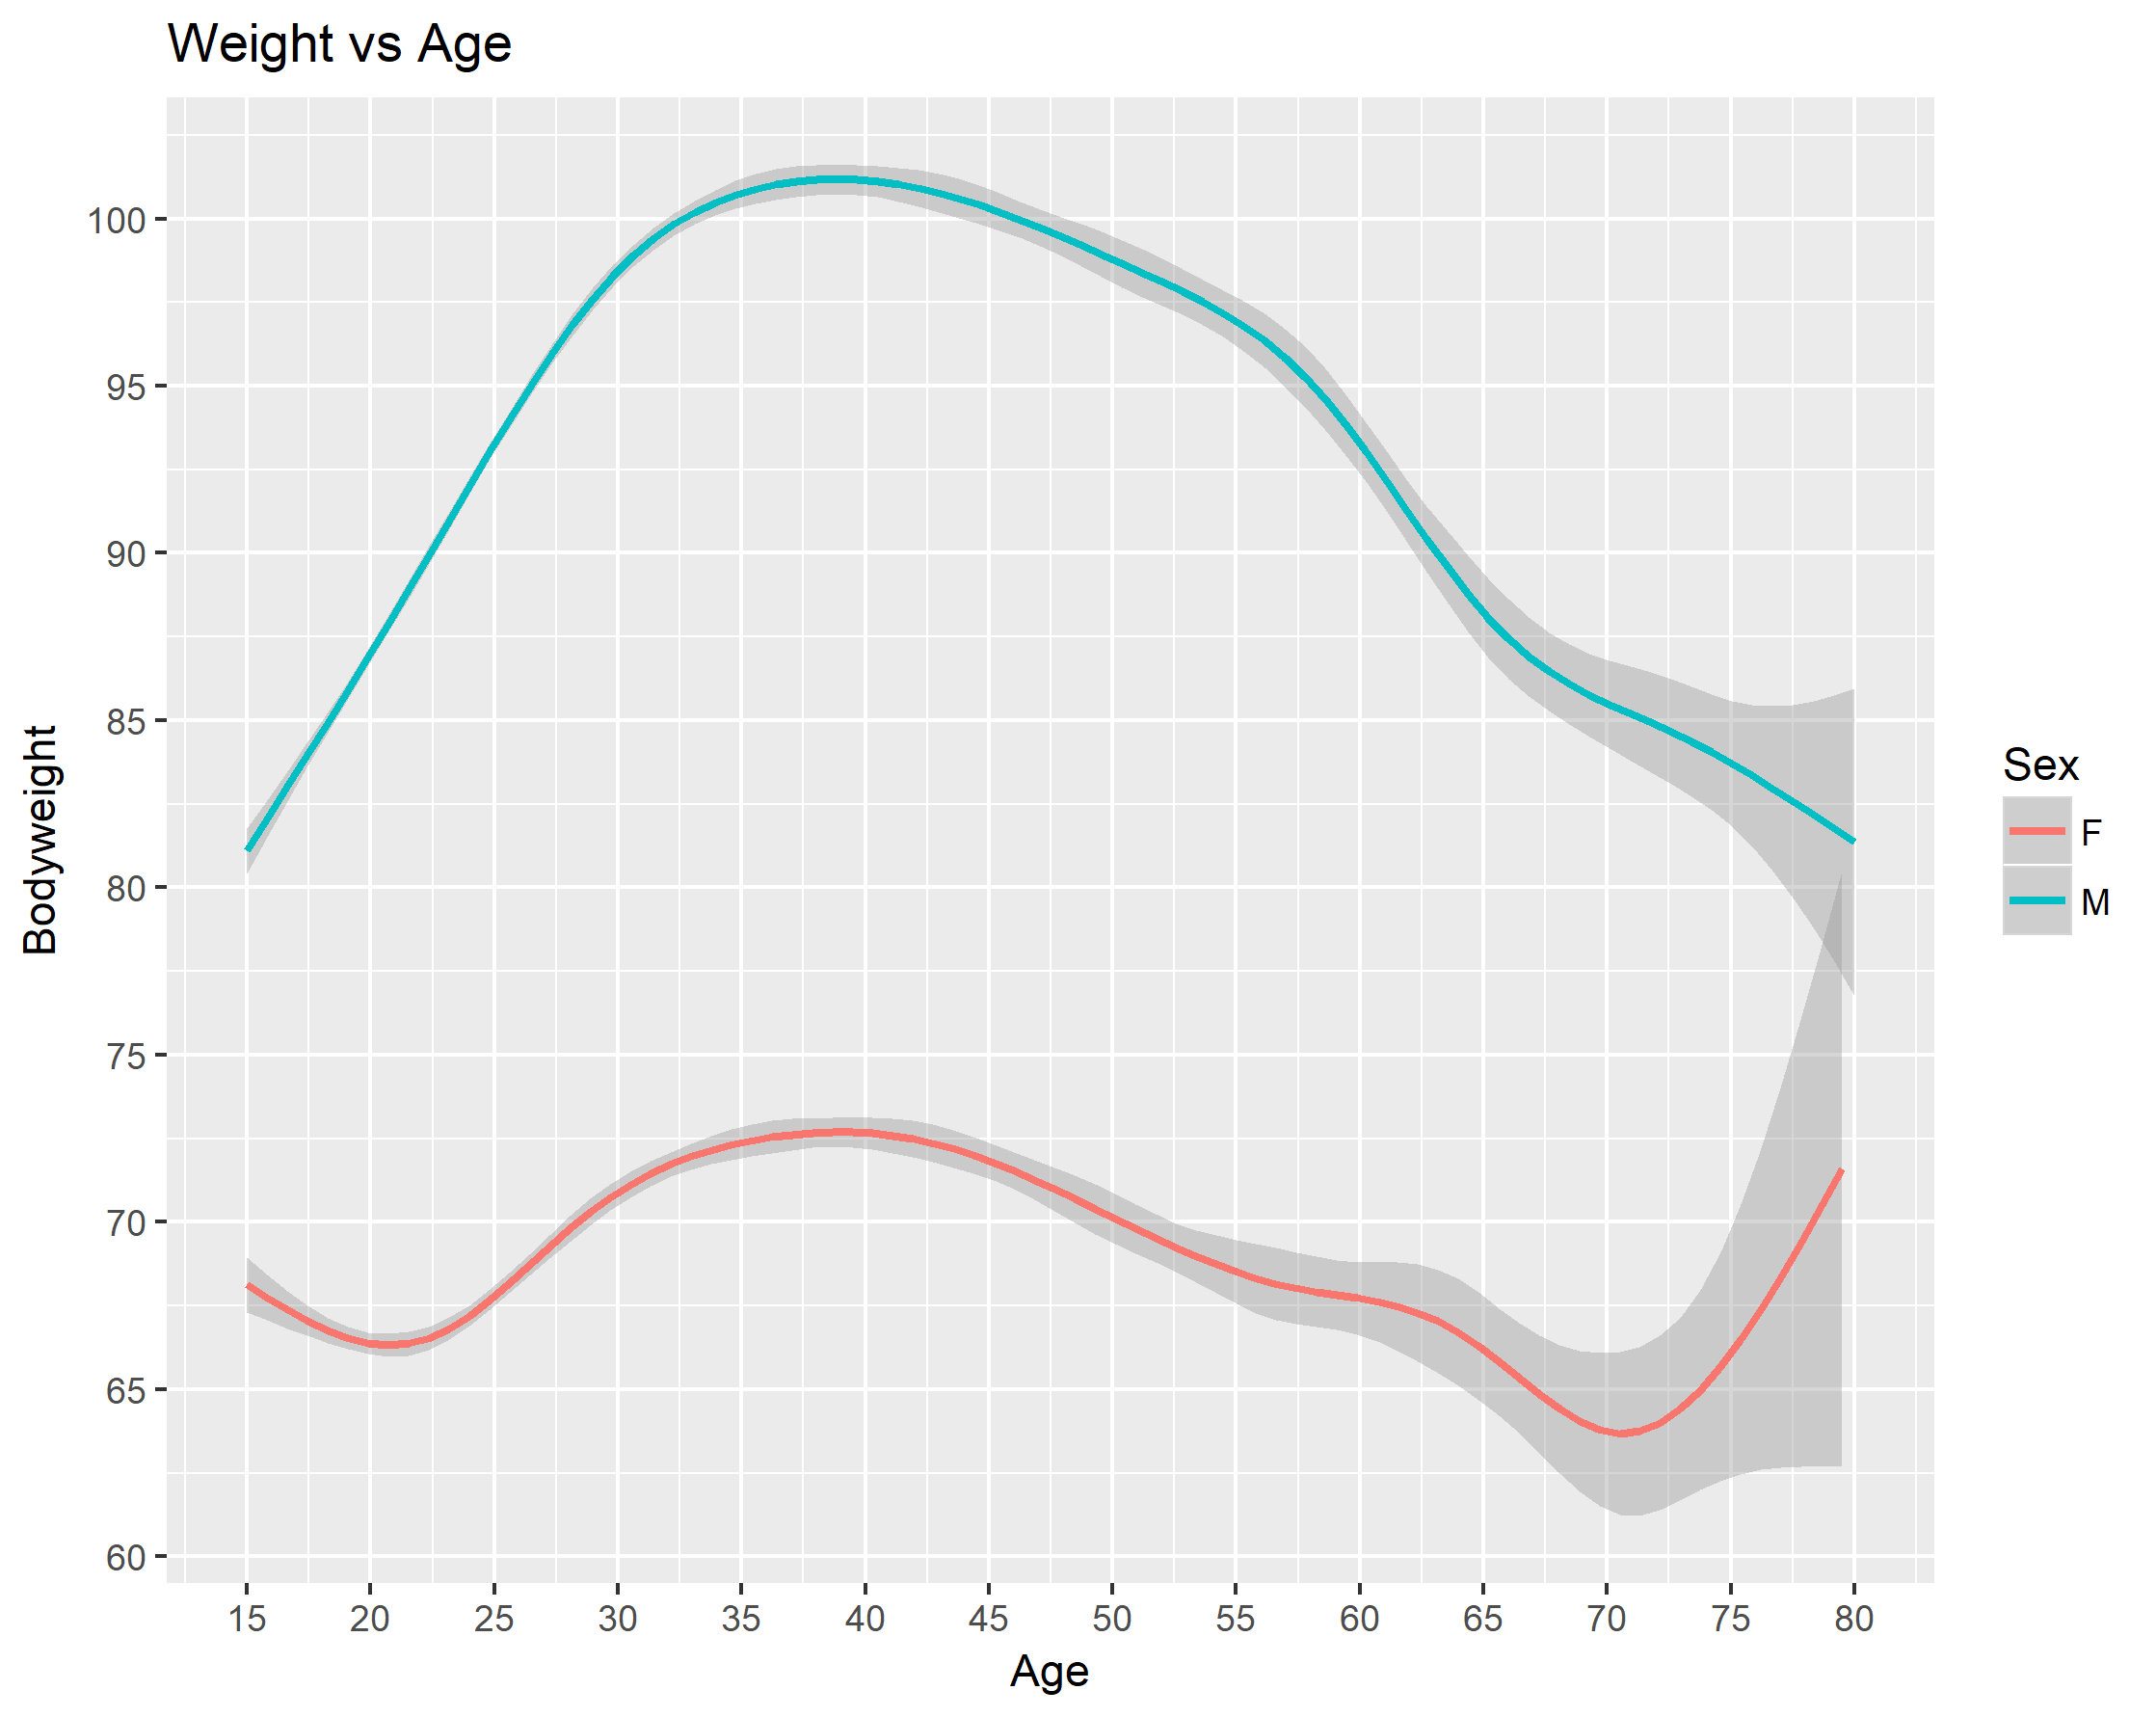
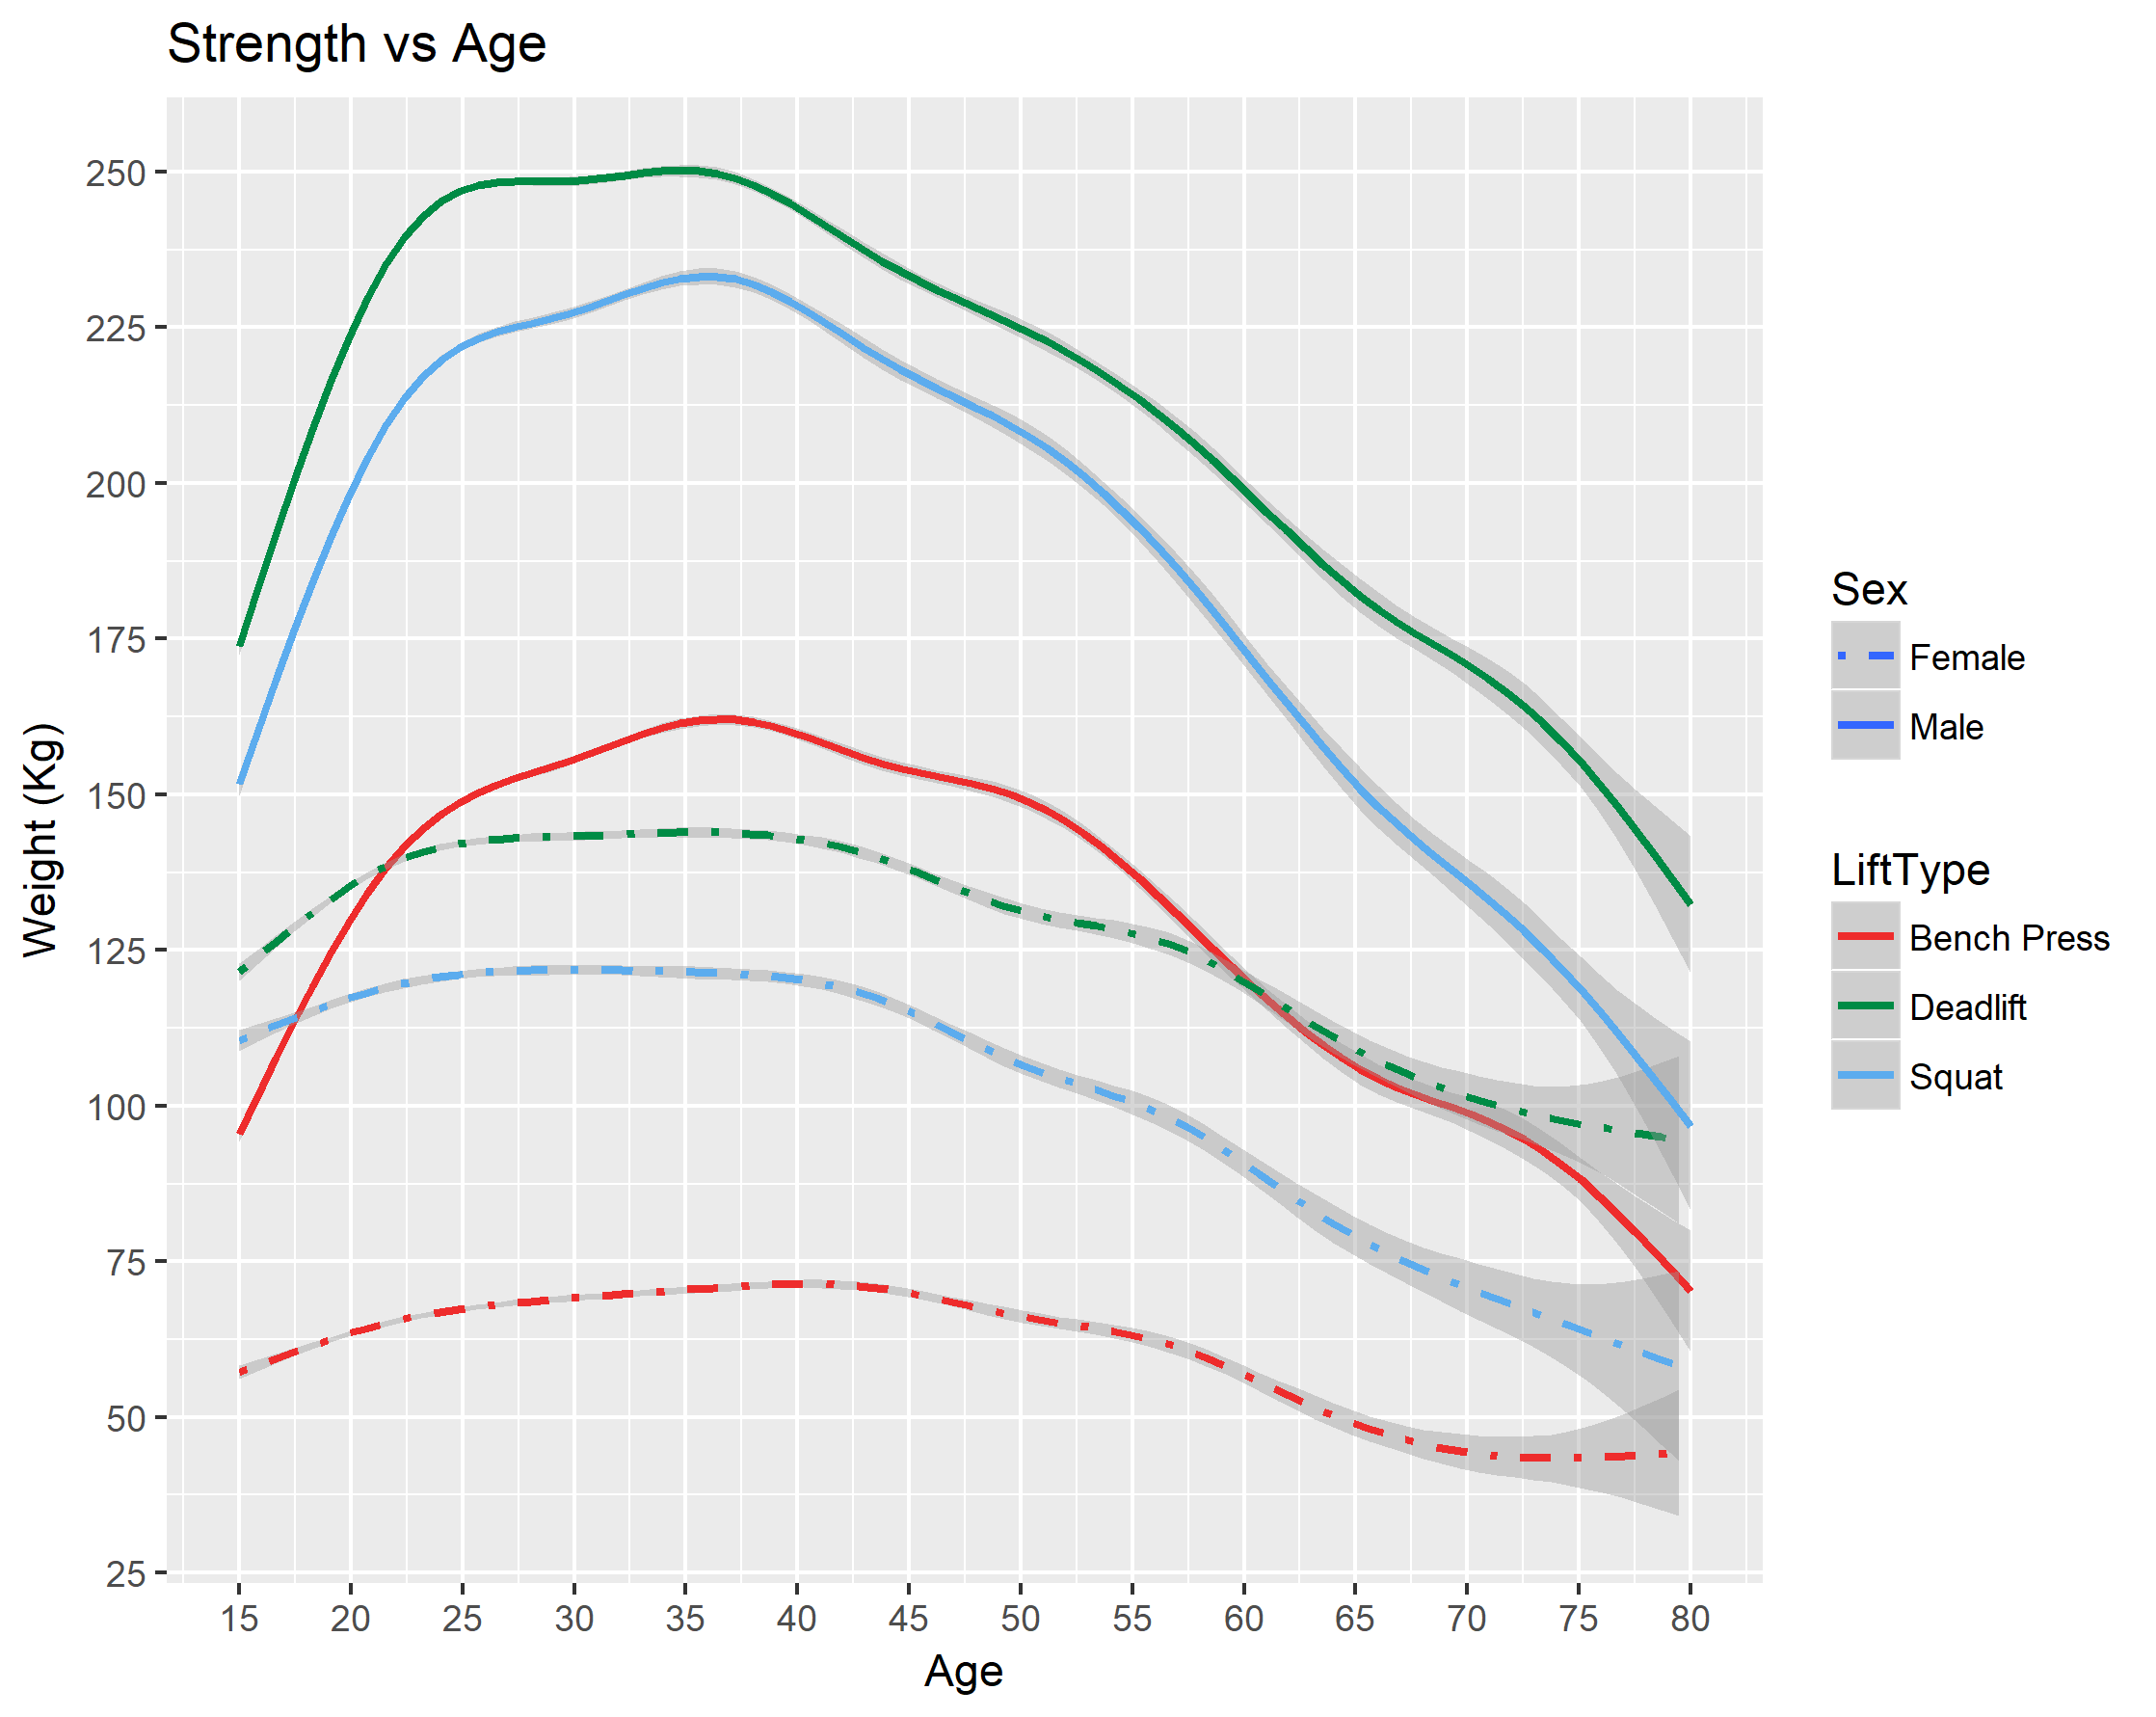
> powerliftingdataclean %>%
+   group_by(Sex) %>%
+   summarize(AvgAge = mean(Age),
+             Count = length(Sex),
+             AvgWeight = mean(BodyweightKg),
+             AvgTotal = mean(TotalKg),
+             AvgBench = mean(BestBenchKg),
+             AvgSquat = mean(BestSquatKg),
+             AvgDeadlift = mean(BestDeadliftKg))
# A tibble: 2 x 8
  Sex   AvgAge Count AvgWeight AvgTotal AvgBench AvgSquat AvgDeadlift

1 F       30.9 33901      69.3      322     66.7      117         138
2 M       29.7 71351      93.3      586    143        211         233